


Abstract
Background: Although the prevalence of cardiovascular disease is declining, the obesity epidemic with associated metabolic syndrome may reverse this trend. Hypothalamic–pituitary–adrenal (HPA) axis activation may underlie the metabolic syndrome, but whether circulating cortisol levels predict vascular disease is less clear. A recent study reported a positive correlation between cortisol levels measured prior to coronary angiography and disease severity, but others have not demonstrated such a relationship. This may be due to different sampling conditions, reflecting basal cortisol levels, vs. responsiveness of HPA axis activity, which may have diverse influences on the pathogenesis of atherosclerosis.
Aims: To determine whether basal circulating cortisol levels predict coronary artery (CAD) or peripheral vascular disease.
Methods: Basal plasma cortisol levels were measured in 278 subjects with suspected CAD, who had undergone elective coronary angiography and in 76 cases and 85 controls with and without peripheral vascular disease, respectively.
Results: After adjustment for potential confounding factors, circulating cortisol levels tended to be lower in those with confirmed coronary vessel disease at angiography (P = 0.10), and in those requiring intervention following angiography (P = 0.07). Lower cortisol levels also predicted those with more symptoms of angina (P = 0.01). Cortisol levels were no different in those with or without peripheral vascular disease.
Conclusion: A single measurement of circulating cortisol is a poor predictor of vascular disease. More detailed characterization of the HPA axis is necessary to determine the role of circulating endogenous glucocorticoids and their responsiveness to stress in atherosclerosis.
Introduction
Although the prevalence of cardiovascular disease in the western world is declining, there is concern that the epidemic of obesity with associated cardiovascular risk factors comprising the metabolic syndrome may lead to a reversal of this trend.1,2 Altered activity of the hypothalamic–pituitary–adrenal (HPA) axis has been hypothesized to underlie the metabolic syndrome. Indeed, there are now several studies linking a raised fasting cortisol and other markers of increased HPA axis activity with cardiovascular risk factors including glucose intolerance, hypertension and dyslipidaemia.3–10 While exogenous glucocorticoid therapy is associated with adverse outcomes from occlusive vascular disease,11,12 whether circulating cortisol levels also predict cardiovascular end-points is less clear. In a large prospective study, a higher morning cortisol: testosterone ratio was associated with ischaemic heart disease in men.13 Cortisol levels alone were not predictive of future cardiac events in this study, but the samples were obtained during unstressed, routine examination. In another small study of 105 subjects, cortisol levels in blood obtained on the morning prior to coronary angiography, circumstances described by the authors as ‘high anticipatory stress’, were positively correlated with severity of coronary artery disease (CAD), independently of other cardiovascular risk factors.14 The discrepancies in these results may reflect differences in basal cortisol levels vs. responsiveness of the HPA axis, which may have diverse influences on the pathogenesis of atherosclerosis. In addition, circulating cortisol levels may be a poor predictor of CAD outcome as, for example, the anti-proliferative and anti-inflammatory effects of glucocorticoids within the vessel wall may protect against vascular (re)-occlusion.15–18 Here, we measured basal circulating cortisol levels in a population of men and women in whom presence of CAD was confirmed by coronary angiography (CAD study), and in a second group of men and women with and without peripheral vascular disease (Edinburgh Artery Study).
Methods
Study design and subjects
CAD study
The study participants included 284 men and women, with symptoms consistent with suspected CAD, who had undergone elective coronary angiography at the Western General Hospital and Royal Infirmary, Edinburgh between October 2002 and March 2005. The study cohort has been described in detail previously.19 Briefly, subjects attended a local research clinic in the morning (between 9 am and 11 am) 1 week following elective cardiac catheterization or at least 3 months after a coronary revascularization procedure (either coronary artery bypass grafting or percutaneous coronary intervention). Demographic information, including details of cardiovascular risk factors, was recorded. Subjects were classified as having diabetes, hypertension, ischaemic heart disease or myocardial infarction as indicated by a previous clinical diagnosis. Hyperlipidaemia was indicated by a previous diagnosis or the use of a cholesterol-lowering agent. Subjects were asked to fast from midnight, to omit their morning medication on the study day, to abstain from alcohol for 24 h and from tobacco and caffeine-containing drinks for 12 h before the study. Subjects with marked left ventricular impairment (ejection fraction <50%), significant valvular heart disease or a history of renal disease were excluded. No subjects had pituitary or adrenal disease or had been taking steroids by any route for 3 months prior to the study. Hospitalization follow-up data was obtained from the Scottish Morbidity Record for all in-patient and day-case discharges (SMR 01).20 Individual diagnoses were classified according to the 10th revision of the International Classification of Disease (ICD-10) codes. Operations were coded based on the Office for Populations Census and Surveys Version 4 (OPCS4) codes for the classification of surgical operations and procedures. Cardiovascular events were defined as non-fatal MI, non-fatal stroke, emergency hospitalization for unstable angina or transient ischaemic attack or coronary revascularization.
Edinburgh artery study
The study participants included men and women who had taken part in a nested case–control study examining the relationship between sex steroid hormone levels and peripheral artery disease within the Edinburgh Artery Study, a prospective study of 809 men and 783 women aged 55–74 years, selected at random from the population.21 The study protocol and details of the nested-study participants, who included 40 men and 43 women and 88 age- and sex-matched controls selected at random from the study population, have been described previously.22 Briefly, at 5-year follow-up of the whole study cohort, subjects completed self-administered questionnaires including validated questions on smoking, cardiovascular events and the WHO angina and intermittent claudication questionnaires.23 Brachial systolic and diastolic blood pressures were recorded after 5 min rest using a random zero sphygmomanometer. Right and left posterior tibial systolic pressures were recorded in the supine position after 5 min rest, using a Doppler probe (Sonicaid, Chichester, UK) and random zero sphygmomanometer. The ankle brachial pressure index (ABPI) was calculated for each limb by dividing the posterior tibial by the brachial pressure. Cases for the nested study were selected if they had either (i) a history of intermittent claudication according to the WHO intermittent claudication questionnaire, plus an ABPI ⩽0.9 in at least one limb or (ii) asymptomatic peripheral arterial disease indicated by an ABPI ⩽0.85 in at least one limb. Controls were selected if they had no history of intermittent claudication and an ABPI ⩾ 1.0 in both legs, no history of cardiovascular disease (including angina, myocardial infarction or stroke) and no evidence of myocardial infarction or ischaemia on ECG. The controls were matched to the cases by sex and 5-year age band. Subjects with diabetes mellitus and women taking hormone replacement therapy were excluded. Following an overnight fast, morning fasting venous blood samples were collected from all selected cases and controls.
Ethical approval was obtained for both studies from the Local Research Ethics Committee and participants gave written informed consent.
Hormone analysis and laboratory measurements
Stored fasting plasma from both studies was analysed for cortisol by radioimmunoassay,24 with intra-assay CV 3.3–7.7%, inter-assay CV 4.5–5%. There was sufficient sample available for measurement of plasma cortisol in 206 men and 72 women in the CAD study and in 35 male cases and 38 male controls, and 41 female cases and 47 controls in the Edinburgh Artery study.
Data analysis
Statistical analysis was carried out using Statistica Release 6. Cortisol levels were loge-transformed for analysis. Differences in mean values of cortisol between study cases and controls were assessed by the t-test. The interaction between cortisol and CAD and peripheral vascular disease parameters was evaluated by multiple stepwise regression analysis. Data are mean (SEM).
Results
Subject characteristics
The characteristics of the subjects participating in the two studies are shown in Table 1. In the CAD study, 35 (12%) of subjects had normal coronary arteries at coronary angiography, 69 (25%) one vessel disease, 95 (34%) two vessel disease and 79 (28%) three vessel disease. Of the subjects, 248 (87%) were taking statin therapy. In the Edinburgh Artery Study, mean ABPI was substantially lower in both male and female cases, over 30% of who had a history of intermittent claudication. In both study populations, mean plasma cortisol levels were significantly higher in men than in women [CAD study: 413 (8.9) vs. 365 (15.4) nmol/l, P = 0.006; Edinburgh Artery Study: 677 (32.3) vs. 550 (25.4) nmol/l, P = 0.002]. There was no association of cortisol with age or body mass index (BMI) in either study. Cortisol levels were not different in those taking anti-platelet, anti-hypertensive, anti-anginal or lipid-lowering therapy (data not shown).
Characteristics of participants
| CAD study | Edinburgh Artery Study | |||
|---|---|---|---|---|
| (n = 278) | Cases (n = 76) | Controls (n = 85) | P-value* | |
| Age (year) | 61.9 (0.5) | 71.6 (0.57) | 70.9 (0.53) | 0.33 |
| Men/Women | 206/72 | 35/41 | 38/47 | |
| BMI (kg/m2) | 28.5 (0.27) | 26.3 (0.42) | 25.9 (0.37) | 0.82 |
| Glucose (mmol/l) | 6.5 (0.19) | 5.6 (0.12) | 5.6 (0.06) | 0.97 |
| Total cholesterol (mmol/l) | 4.7 (0.07) | 6.5 (0.12) | 6.6 (0.12) | 0.45 |
| Triglycerides (mmol/l) | 1.8 (0.06) | 1.9 (0.09) | 1.4 (0.06) | 0.02 |
| HDL cholesterol (mmol/l) | 1.2 (0.02) | 1.2 (0.04) | 1.3 (0.04) | 0.04 |
| Systolic BP (mm Hg) | 133 (1.0) | 155 (2.8) | 144 (2.5) | 0.02 |
| Diastolic BP (mm Hg) | 75 (0.6) | 83 (1.3) | 81 (1.2) | 0.11 |
| ABPI | 0.71 (0.02) | 1.12 (0.01) | <0.0001 | |
| Previous MI | 34 (97%) | 17 (14%) | 0 (0%) | |
| Cortisol (nmol/l) | 401 (7.8) | 598 (30.7) | 616 (28.1) | 0.66 |
Values are mean (SEM) or n (%). *P-value for differences between cases and controls in the Edinburgh Artery Study.
Cortisol and CAD parameters: CAD study
In univariate analysis, fasting cortisol levels did not differ according to symptoms of angina graded using the Canadian Cardiovascular Society (CCS) classification system for angina (Figure 1A), or New York Heart Association (NYHA) classification score. Cortisol levels were also no different in those with a history of previous myocardial infarction (n = 97), those with subsequent admissions with CAD (n = 92), those requiring intervention following angiography (n = 245) or more severe disease at angiography (n = 243) (Figure 1B). In multiple regression analysis, adjustment for age and gender revealed trends for lower cortisol levels in those requiring intervention following angiography and in those with confirmed vessel disease at angiography (Table 2).
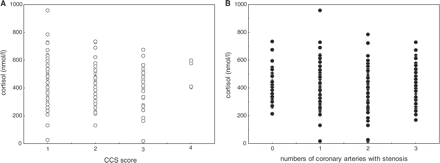
(A) Cortisol levels according to CCS score. Association of mean cortisol levels with symptoms of angina graded using the CCS (Canadian Cardiovascular Society) classification system (Class 4 = most severe). No significant association in univariate analysis (P = 0.22) but inverse association in stepwise regression (P = 0.01) as in Table 3 and (B) Cortisol levels and severity of CAD. Association of mean cortisol levels with numbers of coronary arteries with stenosis at angiography. No significant association in univariate analysis (P = 0.52) or in stepwise regression (P = 0.42) as in Table 2.
Stepwise multiple regression model for predicting the CAD and peripheral vascular disease variables, Model 1
| Variable | Predictor | P-value | Overall r2 |
|---|---|---|---|
| CCS score 1 vs. 2, 3, 4 | Age | 0.002 | 0.05, P = 0.002 |
| Gender | 0.05 | ||
| Cortisol | 0.38 | ||
| NYHA score | Age | 0.004 | 0.04, P = 0.008 |
| Gender | 0.14 | ||
| Cortisol | 0.34 | ||
| CAD admissions | Age | 0.27 | 0.01, P = 0.27 |
| Gender | 0.10 | ||
| Cortisol | 0.94 | ||
| Angio intervention | Age | 0.46 | 0.03, P = 0.02 |
| Gender | 0.01 | ||
| Cortisol | 0.07 | ||
| Vessel disease yes/no | Age | 0.11 | 0.08, P = 0.0005 |
| Gender | 0.00001 | ||
| Cortisol | 0.10 | ||
| Numbers of diseased vessels | Age | 0.02 | 0.08, P = 0.0002 |
| Gender | 0.0001 | ||
| Cortisol | 0.42 | ||
| Hx of Previous MI | Age | 0.67 | 0.03, P = 0.06 |
| Gender | 0.01 | ||
| Cortisol | 0.63 | ||
| ABPI | Case/control | <0.0001 | 0.76, P < 0.0001 |
| Age | 0.19 | ||
| Gender | 0.36 | ||
| BMI | 0.68 | ||
| Cortisol | 0.34 | ||
In further analysis, other predisposing factors for CAD including smoking, hypertension, glucose and total cholesterol were included in the model (Table 3). Lower cortisol levels also predicted those with more symptoms of angina indicated by a higher CCS score and a trend for a higher NYHA score.
Stepwise multiple regression model for predicting the CAD variables, Model 2
| Variable | Predictor | β | P-value | Overall r2 |
|---|---|---|---|---|
| NYHA score | Cortisol | −0.11 | 0.07 | 0.05, P = 0.05 |
| Smoker | 0.47 | |||
| Hypertension | 0.05 | |||
| Glucose | 0.39 | |||
| Total cholesterol | 0.37 | |||
| Statin therapy | 0.68 | |||
| BMI | 0.23 | |||
| CCS | Cortisol | −0.16 | 0.01 | 0.05, P = 0.04 |
| Smoker | 0.07 | |||
| Hypertension | 0.33 | |||
| Glucose | 0.37 | |||
| Total cholesterol | 0.86 | |||
| Statin therapy | 0.58 | |||
| BMI | 0.50 | |||
Cortisol and peripheral vascular disease: Edinburgh Artery Study
There were no differences in mean plasma cortisol levels between cases of peripheral vascular disease and controls with no disease, either in univariate analyses or after adjustment for potential confounding factors of age, BMI, gender and CBG in the multiple regression model (Table 2).
Discussion
Despite the increasing evidence that altered glucocorticoid action influences cardiovascular risk factors comprising the metabolic syndrome, whether endogenous glucocorticoids also affect the incidence of atheromatous end-points is poorly understood. In contrast to a recent study reporting higher cortisol levels measured on the morning of angiography in association with more severe CAD,14 we found no association of higher cortisol levels with severity of CAD at angiography or with peripheral vascular disease. Our samples were measured in the morning, but under unstressed conditions and indeed, we found that these circulating cortisol levels tended to be lower in those with confirmed vessel disease at angiography, and in those requiring intervention following angiography. Lower cortisol levels also predicted those with more symptoms of angina.
There have been few studies relating cortisol to CAD end-point data, and the results have been inconsistent. For example, higher early morning plasma cortisol levels have been correlated with degree of CAD on angiograms in some studies25–27 but not others.28,29 In a prospective study, elevated urinary cortisol combined with traditional cardiovascular risk factors in a model of ‘allostatic load’ predicted incident cardiovascular disease.30 Some of the discrepancies between studies may reflect the differing conditions under which cortisol was collected, and the range and severity of CAD in the study participants. Where more detailed measurements of cortisol are available by use of repeated measurements of salivary cortisol across the day, a flattened diurnal cortisol rhythm has been associated with risk of coronary atherosclerosis,31,32 consistent with our findings of a tendency for lower basal cortisol levels in those with CAD. Interestingly, a recent study reported an association between work stress and greater cortisol awakening response in association with CAD.33 These findings would suggest that responsiveness of the HPA axis may be more predictive of CAD than basal activity of the HPA axis. There are no published studies relating circulating cortisol levels to peripheral vascular disease. One study reported increased carotid intima media thickness (IMT) in 28 subjects with Cushing's syndrome compared with controls matched for age and other cardiovascular risk factors, but cortisol levels were not correlated to IMT in this study.34 However, a recent large study of 1866 subjects found associations between carotid IMT and total cortisol exposure during the day as measured by a salivary cortisol profile.35
Our study has several limitations. The subjects in the CAD study represented a highly ‘diseased’ group with only 12% having normal coronary vessels at angiography. Many of the subjects were also taking medication as secondary prevention for CAD including statins, although data suggests that cortisol levels are not altered by statin use.36 There is no data indicating that other commonly prescribed cardiovascular drugs alter HPA axis activity and we found no differences in cortisol levels with medication use. In addition, cortisol levels did differ between the two study populations, probably reflecting the differing metabolic profile of the subjects in the studies. The higher cortisol levels in the Edinburgh Artery Study would be consistent with the higher blood pressure, glucose and lipid levels in cases and controls compared with the CAD study and are consistent with our previous observations that a high fasting cortisol is associated with cardiovascular risk factors.4–6 In addition, glucocorticoids may directly modify vascular lesion development by inhibiting inflammation, proliferation and angiogenic pathways in the vessel wall and thus circulating cortisol levels may be a poor predictor of atherosclerotic disease outcome.15–18 Our study would appear adequately powered as we included nearly three times as many subjects as the study reporting positive correlations between ‘anticipatory stress’ cortisol and disease severity,14 and we have found positive correlations between cortisol and cardiovascular risk factors in similar size studies.4,5 Finally, all our samples were collected in the morning between 9 am and 11 am; it is possible that diurnal variation obscured any association with atheromatous disease. However, we have shown previously that time of sampling between 0830 h and 1100 h did not affect the relationship between cortisol and cardiovascular risk factors in another cohort.37 It appears that more detailed characterization of the HPA axis is necessary to determine the role of circulating endogenous glucocorticoids in atherosclerosis.
Funding
British Heart Foundation.
Conflict of interest: None declared.
